by Tom King
Table of Contents
Introduction
There are many improvements in SAP Controlling with S/4HANA, including:
- Cost elements are included in General Ledger accounts as a cost element category
- SAP Material Ledger is mandatory, while SAP Actual Costing is optional
- SAP Margin Analysis based on account-based CO-PA and the Universal Journal, has advantages over costing-based CO-PA. All new SAP CO-PA development will take place on Margin Analysis.
Controlling manufacturing order variance analysis is also improved with two new SAP Fiori apps with enhanced views of variance at the order and work center and operation levels, which are now included in the universal journal. Let's examine the two new Fiori apps:
- Production Cost Analysis App ID F1780
- Analyze Costs by Work Center/Operation App ID F3331
Production Cost Analysis App
The Production Cost Analysis app in Figure 1, replaces SAP GUI order selection report S_ALR_87013127.
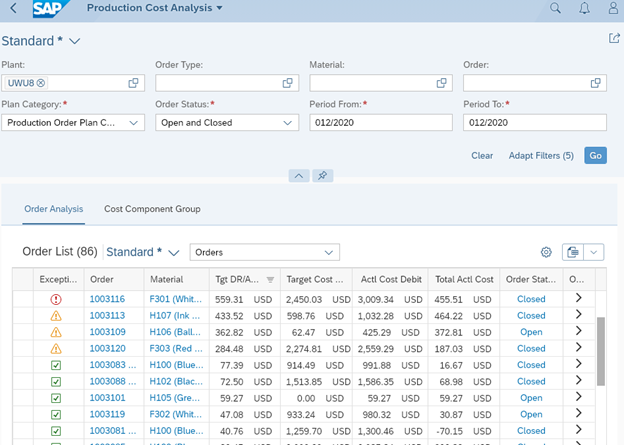
Figure 1: Production Cost Analysis - Summary View
You select the primary report filters at the top to display a summary of production order costs.
A list of orders is displayed with target costs, actual costs, and variances.
Double-click an order to display order detailed costs. This view is similar to the SAP GUI order detail report KKBC_ORD.
Click on ">" (last column) to switch to an individual order. Figure 2 displays a report for order 1003133.
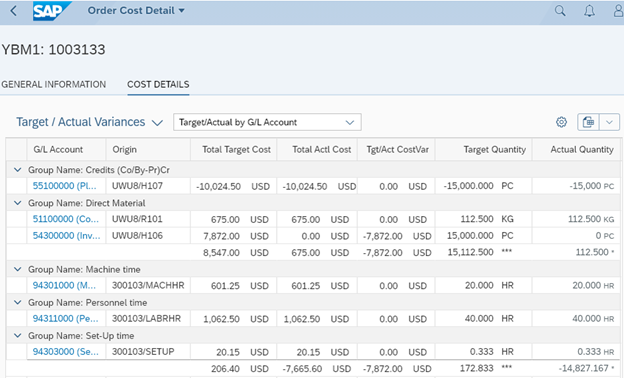
Figure 2: Production Cost Analysis - Order Details
You can group costs by GL account, business transaction, and cost component.
A special view displays order WIP. This app accesses Universal Journal actual and target order costs.
SAP GUI reports S_ALR_87013127 and KKBC_ORD access summary tables COSS and COSP.
SAP Fiori actual costs access Table ACDOCA and target costs access ACDOCP.
A plan category defines the purpose of the plan data. In cost center planning, a plan category is assigned to actual cost center plans, while others are assigned to forecast plans.
Two plan categories are for manufacturing orders: PLANORD01 and PLANORD02.
PLANORD01 plan values use the order preliminary cost estimate, generated during order creation. Order target costs are calculated based on this plan and represent expected costs using the bill of material and routing task list assigned to the order during creation. When the order is processed, variances using these targets represent manufacturing performance. These differences correspond to variance calculations for Target Cost Version 1.
PLANORD02 costs are based on the standard cost estimate, and differences from targets represent total variances for the order. This is similar to Target Cost Version 0 view in previous reports. Total variances are relevant for settlement.
Target costs are calculated from ACDOCP regardless of order status. SAP GUI reports rely on summary tables, target cost calculation is only performed on orders not processed by the variance calculation transaction KKS1. Once this is processed, target costs are set and will not change until you run variance calculation next. This can lead to issues interpreting variance data if activity occurs after VCAL status is set.
Immediate target calculations were only made for orders without VCAL status. Doing this for all orders results in increased report time. Plan table ACDOCP and the speed of HANA allow targets to be recalculated when the report is executed.
Plan Category selection determines the variance view shown. Figure 3 shows the two options.
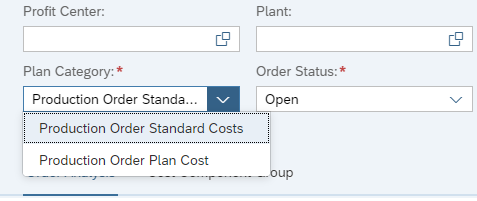
Figure 3: Selecting How Target Costs are Calculated
Production Order Standard Costs targets are calculated based on the standard cost estimate for plan category PLANORD02 in ACDOCP.
Production Order Plan Cost uses the preliminary order cost estimate values with PLANORD01.
Order Status determines the differences that show up in the report:
Open status refers to orders which are released (REL) but not fully delivered (DLV) or technically complete TECO. Differences for these orders are Work in Process WIP.
Closed status orders are either DLV or TECO and differences represent variances.
Order Status selection narrows the list to either open or closed orders.
You can also select both open and closed status to display all orders. The report displays order status.
The SAP GUI order selection report allows you to use a status selection profile to define a range of order status to include or exclude orders from the report. For example, when an order reaches CLSD status, you do not need to include the order in variance reports.
You can achieve this with SAP GUI report S_ALR_87013127 and status selection profiles.
The Production Cost Analysis app does not yet include this functionality.
Join us at SAP Controlling Conference! Meet Tom King and other SAP expert speakers
Click Here to learn more

Analyze Costs by Work Center/Operation App
The Analyze Costs by Work Center/Operation app provides a greater level of detail than available in ECC. This app uses the universal journal additional fields of work center and operation to provide variance management at a more detailed level.
This report contains chart and tabular report sections which are both displayed when you first run the app as shown in Figure 4.
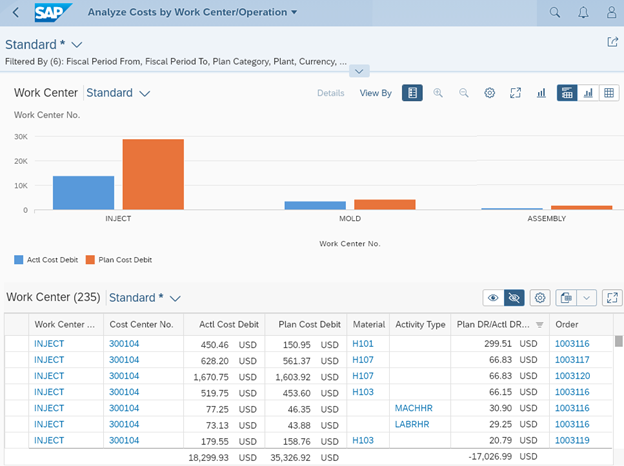
Figure 4: Analyze Costs by Work Center/Operation Initial Report Window
You can expand each section to display more information.
The chart section at the top is useful for comparing the performance of work centers to identify areas for further review.
These examples use bar charts. You can also select pie charts, stacked bar charts, line charts, and scatter charts.
A bar chart view comparing plan/actual debit variances with target/actual debit variances by work center is displayed in Figure 5.
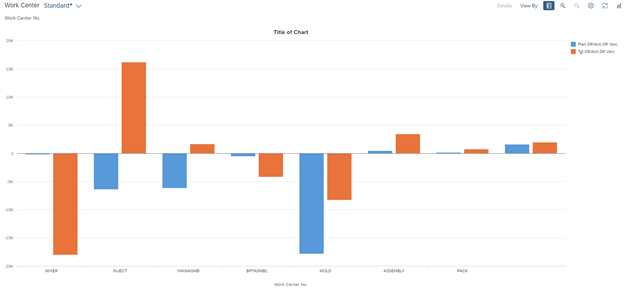
Figure 5: Analyze Costs by Work Center/Operation Chart View
The tabular report shown in Figure 6 details costs at the work center based on both activity posting and material goods issues.
Figure 6 shows the Work Center Summary view. You can select other views.
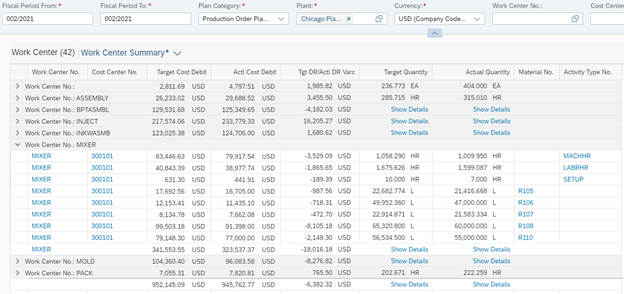
Figure 6: Analyze Costs by Work Center/Operation Tabular View
Production managers now have a view of performance at the work center level.
Component allocations in routings and recipes determine how goods movements are assigned to specific work centers, and the goods issues are displayed along with the activity postings at the work center level.
Like the Production Cost Analysis app, you select the plan category when you execute the report, which allows you to use order-based targets rather than financial targets for analysis.
The data is cumulative for a fiscal period, and the results of corrective actions may not be apparent until the next period. However, having the ability to aggregate this data by work center is helpful for a production manager and opens up new possibilities to control the manufacturing environment.
Glossary
Actual Costs
Actual costs debit a product cost collector or manufacturing order during business transactions, for example, general ledger account postings, inventory goods movements, internal activity allocations, and overhead calculation.
Bill of Material
A bill of material (BOM) is a structured hierarchy of components necessary to build an assembly. BOMs together with purchasing info records allow cost estimates to calculate material costs of assemblies.
Cost Center
A cost center is master data that identifies where the cost occurred. A responsible person assigned to the cost center analyzes and explains cost center variances at period-end.
Cost Component
A cost component identifies costs of similar types, such as material, labor, and overhead costs, by grouping together cost elements in the cost component structure.
Internal Order
An internal order monitors costs and revenue of an organization for short- to medium-term jobs. You can carry out planning at a cost element and detailed level, and you can carry out budgeting at an overall level with availability control.
Operating Rate
The operating rate percentage is defined as (actual activity/plan activity) ? 100. This calculation is used during cost center cost center target cost analysis.
Preliminary Cost Estimate
A preliminary cost estimate calculates the planned costs for a manufacturing order or product cost collector. There can be a preliminary cost estimate for every order or production version, while there can only be one released standard cost estimate for each material. The preliminary cost estimate can be used to valuate scrap and work in process in a WIP at target scenario.
Recipe
A recipe defines the operations and phases which need to be carried out during a manufacturing process. Operations and phases are step by step activities which are carried out during the SAP manufacturing process.
Routing
A routing is a list of tasks containing standard activity times required to perform operations to build an assembly. Routings, together with planned activity prices, provide cost estimates with the information necessary to calculate labor and activity costs of products.
Standard Cost Estimate
This is a material cost estimate used to calculate the standard price of a material. The cost estimate must be executed with a costing variant that updates the material master, and the cost estimate must be released. A standard cost estimate can be released only once per period and is typically created for each product at the beginning of a fiscal year or new season.
Target Cost Version
The target cost version determines the basis for the calculation of target costs. Target cost version 0 calculates total variance and is used to explain the difference between actual debits and credits on an order. It is the only target cost version that can be settled to Financial Accounting, Profit Center Accounting (PCA), and Profitability Analysis (CO-PA).
Target Costs
Target costs are plan costs adjusted by the delivered quantity. For example, if the quantity delivered to inventory is 50% of the plan quantity, target costs are calculated as 50% of the plan costs.
Universal Journal
The Universal Journal brings together the once-separate components Financial Accounting (FI) and Controlling (CO) into Tables ACDOCA and ACDOCP.
Variance Categories
During variance calculation, the order balance is divided into categories on the input and output sides. Variance categories provide reasons for the cause of the variance, which you can use when deciding corrective action.
Work Center
Operations are carried out at work centers representing; for example, machines, production lines, or employees. Work center master data contains a mandatory cost center field. A work center can only be linked to one cost center, while a cost center can be linked to many work centers.
SAP Fiori
SAP Fiori is a web based interface for SAP which accesses the Universal Journal directly. You can use SAP Fiori in place of the SAP GUI. Delivers a personalized, web-based and role-based user experience (UX) for SAP. Using modern design principles, it simplifies the UX across all lines of business, tasks and devices.
Statistical Key Figure
Statistical key figures define values describing cost centers, profit centers, and overhead orders such as number of employees or minutes of long-distance phone calls. You use statistical key figures as the tracing factor for periodic transactions such as cost center distribution or assessment. You can post both plan and actual statistical key figures.
Template
A template allows you to assign senders and receivers, calculate what is to be sent based on nearly any field available in orders and master data, and determine when the line is activated. A template exists within an environment, which defines columns available in the template.
Transfer Control
Transfer control is a costing variant component that requires a higher-level cost estimate to use recently created standard cost estimates for all lower-level materials. Preliminary cost estimates for product cost collectors use transfer control.
Unit Costing
Unit costing is a method of costing that does not use BOMs or routings, typically when developing new products. You create a preliminary structure of materials and activities in a view similar to the layout of a spreadsheet.
Universal Journal
This eliminates the need for transaction tables in several different modules, and instead combines them into one line item table: ACDOCA. All financial reports read from the one table eliminating the need for reconciliation and table locks.
User Exit
A user exit is a point in the standard program where you can call your own program. In contrast to customer exits, user exits allow developers to access and modify program components and data objects in the standard system.
Valuation Variant
The valuation variant is a costing variant component that allows different search strategies for materials, activity types, subcontracting, and external processing. For example, the search strategy for purchased and raw materials typically searches first for a price from the purchasing info record.